Position framework
Running back
High-value touches against expected points
Updated
Methodology
Running back scoring follows opportunity, and not all opportunity is equal. A target is worth roughly twice a carry in PPR, and a carry inside the 10 is worth several. HVT/G weights the touches that actually decide the position, and it survives the week-to-week noise that raw carry counts do not.
The evidence
2025 productionEverything below is last season, not a projection of this one. That is the point: a projection is an opinion, and these are the numbers an opinion has to survive.
01High-value touches decide the position
The relationship is about as tight as anything in fantasy football, which is the first thing worth saying: points follow high-value touches, so the argument about a back is really an argument about how many he will get. McCaffrey sits alone at 9.8 per game, nearly three times the league median of 3.7.
The useful names are the ones off the line. A back sitting below it is being given the work and not converting it, which is usually offense quality rather than the back. Above it, he is scoring on less, which is efficiency that regresses. Neither is a buy on its own; both are a question worth asking before you spend a second-round pick.
02Separating the line from the back
Yards before contact is the offensive line’s point-of-attack blocking. Yards after contact is the back. Splitting them stops you crediting a runner for his line, or blaming him for it, and the pairs inside one backfield are where it gets useful.
Gibbs and Montgomery run behind the same line and post the same yards after contact; Gibbs simply gets more space, because Montgomery is the one taking the heavy boxes and the short yardage. Walker and Charbonnet is the same story with the roles reversed. When two backs share a line, the difference in yards before contact is a difference in role, not ability, and role is the thing that changes in September.
03On the field is not the same as targeted
Route participation says a back is out there on passing downs. Targets per route run says the quarterback is looking at him. The bottom-right corner is the trap: high participation, no targets, which is a back running routes as a decoy, whose receiving usage looks real in a box score and produces nothing.
McCaffrey and Gibbs clear the field on both axes, which is why they price the way they do. Further down, the Seattle backfield draws few targets either way, which reads as system preference rather than a depth chart to bet on.
04What a top-three season has looked like
| Season | Back | Rush att | Rush yds | Rush TD | Rec | Tgt | Rec yds | Rec TD | Off. rank | O-line | Age | GZ att | HVT |
|---|---|---|---|---|---|---|---|---|---|---|---|---|---|
| 2025 | Christian McCaffrey | 311 | 1202 | 10 | 102 | 129 | 924 | 7 | 4 | 5 | 29 | 37 | 166 |
| Bijan Robinson | 287 | 1478 | 7 | 79 | 103 | 820 | 4 | 21 | 26 | 23 | 17 | 120 | |
| Jahmyr Gibbs | 243 | 1223 | 13 | 77 | 94 | 616 | 5 | 15 | 6 | 23 | 22 | 116 | |
| 2024 | Jahmyr Gibbs | 250 | 1412 | 16 | 52 | 63 | 517 | 4 | 2 | 9 | 22 | 26 | 89 |
| Saquon Barkley | 345 | 2005 | 13 | 33 | 43 | 278 | 2 | 5 | 3 | 27 | 28 | 71 | |
| Bijan Robinson | 304 | 1456 | 14 | 61 | 72 | 431 | 1 | 17 | 18 | 22 | 34 | 106 | |
| 2023 | Christian McCaffrey | 272 | 1459 | 14 | 67 | 83 | 564 | 7 | 2 | 5 | 27 | 34 | 117 |
| Breece Hall | 223 | 994 | 5 | 76 | 95 | 591 | 4 | 25 | 32 | 22 | 10 | 105 | |
| Travis Etienne | 267 | 1008 | 11 | 58 | 73 | 476 | 1 | 13 | 24 | 24 | 16 | 89 | |
| 2022 | Austin Ekeler | 204 | 915 | 13 | 107 | 127 | 722 | 5 | 7 | 19 | 27 | 24 | 151 |
| Christian McCaffrey | 244 | 1139 | 8 | 85 | 108 | 464 | 5 | 3 | 24 | 26 | 21 | 129 | |
| Josh Jacobs | 340 | 1653 | 12 | 53 | 64 | 400 | 0 | 25 | 10 | 24 | 23 | 87 | |
| 2021 | Jonathan Taylor | 332 | 1811 | 18 | 40 | 51 | 360 | 2 | 10 | 12 | 22 | 41 | 92 |
| Austin Ekeler | 206 | 911 | 12 | 70 | 94 | 647 | 8 | 19 | 10 | 26 | 25 | 119 | |
| Najee Harris | 307 | 1200 | 7 | 74 | 94 | 467 | 3 | 18 | 26 | 23 | 17 | 111 | |
| 2020 | Alvin Kamara | 187 | 932 | 16 | 83 | 107 | 756 | 5 | 2 | 8 | 25 | 28 | 135 |
| Dalvin Cook | 312 | 1557 | 16 | 44 | 54 | 361 | 1 | 22 | 26 | 25 | 35 | 89 | |
| Derrick Henry | 378 | 2027 | 17 | 19 | 31 | 114 | 0 | 11 | 15 | 26 | 35 | 66 | |
| 2019 | Christian McCaffrey | 287 | 1387 | 15 | 116 | 142 | 1005 | 4 | 28 | 18 | 23 | 32 | 174 |
| Aaron Jones | 236 | 1084 | 16 | 49 | 68 | 474 | 3 | 5 | 6 | 24 | 19 | 87 | |
| Ezekiel Elliott | 301 | 1357 | 12 | 54 | 71 | 420 | 2 | 14 | 4 | 24 | 31 | 102 | |
| 2018 | Saquon Barkley | 261 | 1307 | 11 | 91 | 121 | 721 | 4 | 26 | 21 | 21 | 30 | 151 |
| Christian McCaffrey | 219 | 1098 | 7 | 107 | 124 | 867 | 6 | 14 | 17 | 22 | 29 | 153 | |
| Todd Gurley | 256 | 1251 | 17 | 59 | 81 | 580 | 4 | 1 | 6 | 24 | 36 | 117 | |
| 2017 | Todd Gurley | 279 | 1305 | 13 | 64 | 87 | 788 | 6 | 5 | 6 | 23 | 32 | 119 |
| Le'Veon Bell | 321 | 1291 | 9 | 85 | 107 | 655 | 2 | 2 | 12 | 25 | 27 | 134 | |
| Alvin Kamara | 120 | 728 | 8 | 81 | 100 | 826 | 5 | 4 | 9 | 22 | 13 | 113 | |
| Median | 272 | 1291 | 13 | 70 | 94 | 580 | 4 | 12 | 12 | 24 | 28 | 116 | |
| 25th | 239.5 | 1091 | 9.5 | 53.5 | 69.5 | 447.5 | 2 | 4 | 6 | 22.5 | 21.5 | 90.5 | |
| 75th | 309 | 1457.5 | 15.5 | 84 | 107 | 739 | 5 | 18.5 | 20 | 25.5 | 33 | 131.5 | |
| Min | 120 | 728 | 5 | 19 | 31 | 114 | 0 | 1 | 3 | 21 | 10 | 66 | |
| Max | 378 | 2027 | 18 | 116 | 142 | 1005 | 8 | 28 | 32 | 29 | 41 | 174 | |
- 129
- best in that column, all 27 seasons
- 102
- top quarter of that column, the good end, so a low number under Off. rank and O-line
- 31
- bottom quarter of that column
- 29
- youngest and oldest season in the sample
Twenty-seven finishes, and no single profile among them. Henry’s 2020 is 378 carries and 31 targets; McCaffrey’s 2019 is 287 and 142. Both finished top three, and nothing about the first tells you how to value the second. Read down a column rather than across a row: the median is the bar, and the spread around it is how much the bar moves.
The two rank columns are the ones people skip. The median top-three back ran behind the 12th offensive line on the 12th ranked offense: not an elite situation, but not a bad one either, and the 75th percentile at 20th says a genuinely poor line has produced this finish more than once. Age is the tighter constraint: 22 to 26 covers the middle half, and only two seasons in nine years came from outside it.
| Benchmark | RB 1-3 | Value RB (4-10) |
|---|---|---|
| Carries | 272 | 239.5 |
| Targets | 94 | 69.5 |
| Receptions | 70 | 53.5 |
| Age | 24 | 25.5 |
| Team Rank | 12 | n/a |
| Green Zone Rushes | 28 | 21.5 |
| High Value Touches | 116 | 90.5 |
| Clearing it now |
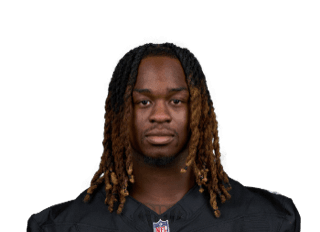
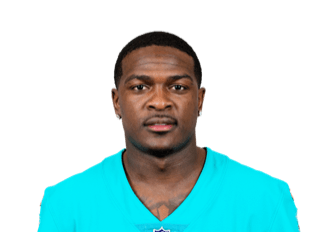
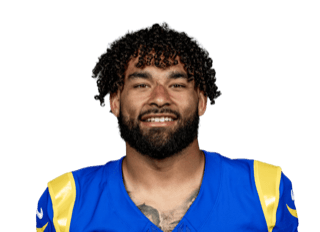
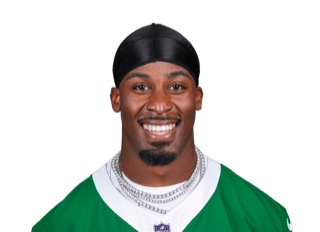
The two tiers are closer than the draft price suggests. Roughly thirty carries and twenty-five targets separate a top-three season from a fourth-to-tenth one. That gap is one injury, or one change of coordinator, wide.
05Who actually owns a backfield
| # | Team | Back | Opp. share |
|---|---|---|---|
| 1 | LV | Ashton Jeanty | 84.3% |
| 2 | IND | Jonathan Taylor | 84.0% |
| 3 | SF | Christian McCaffrey | 76.7% |
| 4 | PHI | Saquon Barkley | 76.2% |
| 5 | CIN | Chase Brown | 71.9% |
| 6 | BAL | Derrick Henry | 70.5% |
| 7 | JAX | Travis Etienne Jr | 70.0% |
| 8 | ATL | Bijan Robinson | 69.9% |
| 9 | BUF | James Cook | 68.8% |
| 10 | NYJ | Breece Hall | 68.1% |
| 11 | TEN | Tony Pollard | 67.2% |
| 12 | MIA | De'Von Achane | 65.3% |
| 13 | DAL | Javonte Williams | 65.2% |
| 14 | LAR | Kyren Williams | 64.8% |
| 15 | DET | Jahmyr Gibbs | 63.6% |
| 16 | GB | Josh Jacobs | 59.9% |
| 17 | CAR | Rico Dowdle | 59.2% |
| 18 | CHI | D'Andre Swift | 56.6% |
| 19 | CLE | Quinshon Judkins | 56.2% |
| 20 | PIT | Jaylen Warren | 52.8% |
| 21 | SEA | Kenneth Walker | 51.3% |
| 22 | NE | TreVeyon Henderson | 48.9% |
| 23 | HOU | Woody Marks | 48.7% |
| 24 | WAS | Jacory Croskey-Merritt | 47.0% |
| 25 | NO | Alvin Kamara | 45.1% |
| 26 | NYG | Tyrone Tracy Jr | 44.9% |
| 27 | KC | Kareem Hunt | 44.2% |
| 28 | DEN | RJ Harvey | 43.3% |
| 29 | TB | Bucky Irving | 42.5% |
| 30 | LAC | Kimani Vidal | 41.3% |
| 31 | MIN | Jordan Mason | 40.9% |
| 32 | ARI | Michael Carter | 32.9% |
Every team’s most-used back, by his share of the carries and targets that went to the backfield. The spread is the story: 84% at the top against 33% at the bottom. The top of this table is where bell-cow backs live, and there are far fewer of them than there are picks in the first two rounds.
Read the bottom half as a warning rather than a ranking. A back at forty percent of his own backfield is one injury or one hot hand from being a committee piece, and no amount of talent in the abstract fixes a snap count.
06The usage that survives a bad script
| # | Team | Back | Targets |
|---|---|---|---|
| 1 | SF | Christian McCaffrey | 129 |
| 2 | ATL | Bijan Robinson | 103 |
| 3 | DET | Jahmyr Gibbs | 94 |
| 4 | CIN | Chase Brown | 88 |
| 5 | MIA | De'Von Achane | 85 |
| 6 | PIT | Kenny Gainwell | 85 |
| 7 | LV | Ashton Jeanty | 73 |
| 8 | DEN | RJ Harvey | 58 |
| 9 | IND | Jonathan Taylor | 55 |
| 10 | JAX | Travis Etienne Jr | 52 |
| 11 | DAL | Javonte Williams | 51 |
| 12 | CAR | Rico Dowdle | 50 |
| 13 | LAR | Kyren Williams | 50 |
| 14 | PHI | Saquon Barkley | 50 |
| 15 | TEN | Tyjae Spears | 50 |
| 16 | CHI | D'Andre Swift | 48 |
| 17 | NYJ | Breece Hall | 48 |
| 18 | NYG | Tyrone Tracy Jr | 47 |
| 19 | ARI | Michael Carter | 45 |
| 20 | TB | Rachaad White | 45 |
| 21 | GB | Josh Jacobs | 44 |
| 22 | NE | TreVeyon Henderson | 42 |
| 23 | MIN | Aaron Jones | 41 |
| 24 | BUF | James Cook | 40 |
| 25 | CLE | Dylan Sampson | 40 |
| 26 | NO | Alvin Kamara | 39 |
| 27 | HOU | Woody Marks | 36 |
| 28 | SEA | Kenneth Walker | 36 |
| 29 | KC | Brashard Smith | 35 |
| 30 | LAC | Omarion Hampton | 35 |
| 31 | WAS | Jeremy McNichols | 31 |
| 32 | BAL | Justice Hill | 27 |
Carries depend on the scoreboard. Targets mostly do not. A back who catches passes keeps scoring in the games his team is losing, which is exactly when a rushing workload disappears. That is why Christian McCaffrey at 129 targets has a floor that a pure runner on the same volume does not.
Compare this order against the one above it. A back near the top of both owns his backfield in every game state. A back high on opportunity share but low here is a game-script bet, and worth less in a league that starts a flex.
07Who to run at
| Rank | 2025 | 2024 | 2023 | 2022 | 2021 | |||||
|---|---|---|---|---|---|---|---|---|---|---|
| Fewest allowed | Most allowed | Fewest allowed | Most allowed | Fewest allowed | Most allowed | Fewest allowed | Most allowed | Fewest allowed | Most allowed | |
| 132 | JAX | CIN | BAL | CAR | CHI | ARI | TEN | HOU | TEN | PIT |
| 231 | HOU | NYG | MIN | WAS | DET | SEA | SF | CHI | BAL | HOU |
| 330 | SEA | WAS | TB | NO | NE | DEN | BAL | SEA | TB | LAC |
| 429 | DEN | NYJ | PHI | DAL | TB | NYG | MIA | DET | NO | NYJ |
| 528 | TB | BUF | DEN | LAR | SF | GB | CIN | NYG | LAR | DET |
| 627 | NE | MIA | DET | CHI | MIN | WAS | BUF | LAC | SF | ATL |
| 726 | IND | CHI | GB | NYG | MIA | CIN | NE | GB | CIN | MIN |
| 825 | KC | ARI | MIA | TEN | HOU | NYJ | KC | CLE | WAS | NYG |
| 924 | BAL | ATL | HOU | JAX | JAX | IND | PIT | NO | PHI | NE |
| 1023 | LAC | DAL | KC | IND | CLE | CAR | DEN | ATL | GB | CHI |
| Rank | 2025 | 2024 | 2023 | 2022 | 2021 | |||||
|---|---|---|---|---|---|---|---|---|---|---|
| Run against least | Run against most | Run against least | Run against most | Run against least | Run against most | Run against least | Run against most | Run against least | Run against most | |
| 132 | JAX | MIN | MIN | CAR | SF | CAR | TEN | CHI | TB | CHI |
| 231 | SEA | NYJ | BAL | TEN | PHI | ARI | KC | HOU | TEN | HOU |
| 330 | DEN | NO | TB | NYG | CHI | NYJ | BAL | GB | BAL | DET |
| 429 | TB | LV | DET | IND | BAL | DAL | MIA | SEA | CIN | ATL |
| 528 | BAL | CLE | PHI | WAS | TB | ATL | BUF | CLE | LAR | JAX |
| 627 | IND | CAR | MIA | NE | DET | IND | SF | IND | GB | LAC |
| 726 | HOU | WAS | DEN | NYJ | JAX | SEA | CIN | ATL | KC | CAR |
| 825 | LAR | BUF | LAC | CHI | LAR | GB | NE | NO | MIA | NYJ |
| 924 | PIT | MIA | PIT | CLE | BUF | NE | DEN | NYJ | IND | NE |
| 1023 | NE | CIN | GB | SF | MIN | LV | ARI | LAC | NO | PIT |