Position framework
Tight end
Route participation against target share
Updated
Methodology
Tight end is the position where volume and role come apart. A tight end can run almost every route his offense runs and still finish outside the top twelve, because running the route and being thrown the ball are two different jobs. What follows holds role against production one pair at a time: participation against target share, then against target rate, then yardage against touchdowns, then downfield role, and finally the efficiency pair the history turns on. Every number is last season's, because a projection is an opinion and these are what an opinion has to survive.
The evidence
2025 productionFive pairs, each followed by what it says. The last of them is the one the history at the foot of the page actually turns on.
Route participation against target share
Route participation is the chance and target share is the conversion. The tight ends in the top right are running the routes and drawing the looks; the ones adrift to the right of the median with nothing above it are on the field for a living, not for the ball.
Routes + Targets (Best)
- Trey McBride
- George Kittle
- Brock Bowers
- Tyler Warren
- Kyle Pitts
Decoys (routes but no targets)
- Dallas Goedert
- Hunter Henry
- Sam LaPorta
- TJ Hockenson
- AJ Barner
Fades
- Colby Parkinson
- Dalton Kincaid
- Colston Loveland
- Oronde Gadsden
Route participation against targets per route run
The same route count, divided differently. Target share rewards a tight end whose offense throws a lot; targets per route run does not care how often his team drops back, only how often the ball comes when he goes out. Where a name sits well below its position on the first chart, the volume was the offense’s, not his.
Routes + Targets
- Trey McBride
- Kyle Pitts
- Brock Bowers
- Tyler Warren
- George Kittle
Routes + No Targets
- TJ Hockenson
- AJ Barner
- Dallas Goedert
- Hunter Henry
- Oronde Gadsden
High Target Rate
- Dalton Kincaid
- Harold Fannin Jr
- George Kittle
- Trey McBride
- Colby Parkinson
Yards per game against touchdowns
Touchdowns are the noisiest thing a tight end does and the easiest to draft on. Yardage per game is close to a role measure; touchdowns are a role measure multiplied by the field position his offense happened to find. A season high on the vertical and ordinary on the horizontal is the one least likely to happen twice.
Yards + TDs
- Trey McBride
- Tucker Kraft
- George Kittle
- Brock Bowers
- Kyle Pitts
TD Inflation
- Dallas Goedert
- Colby Parkinson
- Mark Andrews
- AJ Barner
- Jake Ferguson
Yards + TD Improvement?
- Juwan Johnson
- Kyle Pitts
- Tucker Kraft
- Dalton Schultz
- Brenton Strange
- Oronde Gadsden
Air yards share against targets per route run
Air yards share says how far downfield the offense is willing to look for him; targets per route run says how often it looks at all. Together they separate the seam threat from the safety valve. Two tight ends can catch the same number of balls and be doing completely different jobs.
Deep Routes + Targets
- Trey McBride
- Brock Bowers
- Kyle Pitts
Strong Safety
- Colby Parkinson
- Tucker Kraft
- Jake Ferguson
Fades
- David Njoku
- AJ Barner
- TJ Hockenson
Route participation against yards per route run
The pair the history below actually turns on. Yards per route run is efficiency with the route count divided out, so it survives a change of offense better than yardage does; holding it against participation shows whether the rate came with a starter’s workload or from a sample small enough to flatter anyone.
What has happened before
2011-2025Since 2016, 10 TEs have hit 50+ YPG with a YPRR of 1.70 or lower. Only 2 of those 10 repeated the following season. That’s your flashing warning light.
Among 22 TEs with 40–60% route participation and a 1.50+ YPRR (top-12 threshold), 11 of 13 (85%) who played at least eight games the next season saw increased route share.
| The screen | Who it catches this year |
|---|---|
| 1. 50+ YPG & sub 1.7 YPRR | Travis Kelce |
| 2. 40-60% Route Participation & 1.5+ YPRR | Colby Parkinson & Dalton Kincaid |
Checking the boxes
2011-2025One column per factor, each name carrying his own figure for it. The argument is not that any single column picks a TE1. It is that the same few names keep appearing column after column, measured against the fifteen-year averages above, and a player who clears five of six is not doing it by accident.
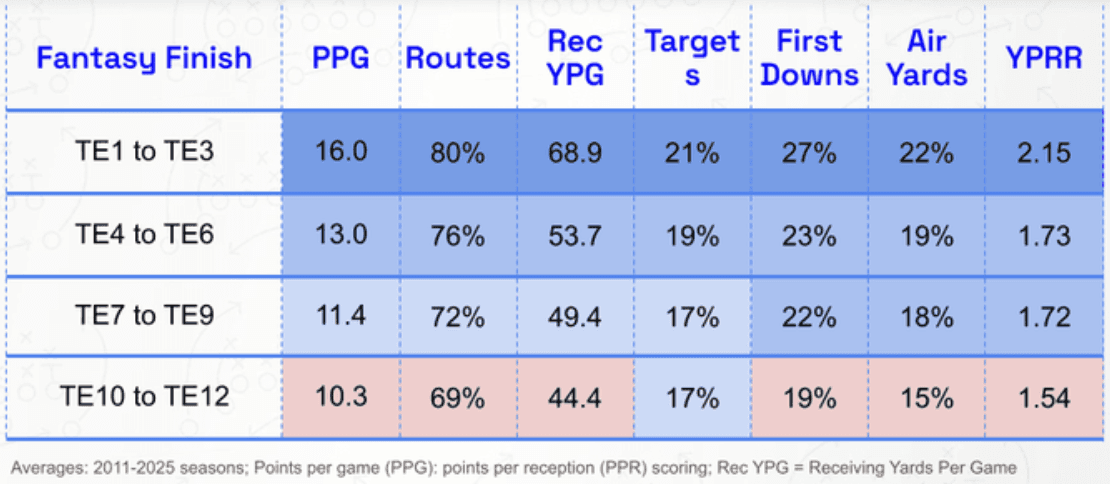
TE1-3
| Route % | YPG | Target Share % | Air Yards % | YPRR | BEST CANDIDATES |
|---|---|---|---|---|---|
| Trey McBride (96.60) | Trey McBride (72.90) | Trey McBride (27.40) | Trey McBride (24.60) | Dalton Kincaid (3.02) | Trey McBride |
| Dallas Goedert (91.60) | n/a | Brock Bowers (23.60) | Brock Bowers (22.80) | Tucker Kraft (2.56) | Brock Bowers |
| Kyle Pitts (90.40) | n/a | George Kittle (22.80) | n/a | George Kittle (2.24) | George Kittle (Injury) |
| Brock Bowers (89.80) | n/a | Kyle Pitts (22.70) | n/a | n/a | n/a |
| Tyler Warren (87.00) | n/a | Tyler Warren (22.40) | n/a | n/a | n/a |
| Travis Kelce (83.20) | n/a | Harold Fannin Jr (21.60) | n/a | n/a | n/a |
| Sam LaPorta (83.00) | n/a | n/a | n/a | n/a | n/a |
| Dalton Schultz (81.10) | n/a | n/a | n/a | n/a | n/a |
| George Kittle (80.20) | n/a | n/a | n/a | n/a | n/a |
TE4-6
| Route % | YPG | Target Share % | Air Yards % | YPRR | BEST CANDIDATES |
|---|---|---|---|---|---|
| Juwan Johnson (78.90) | Tucker Kraft (61.10) | Dallas Goedert (20.00) | Kyle Pitts (20.80) | Sam LaPorta (2.00) | Kyle Pitts |
| AJ Barner (78.30) | George Kittle (57.10) | Travis Kelce (19.70) | n/a | Colston Loveland (1.96) | Sam LaPorta |
| TJ Hockenson (78.30) | Brock Bowers (56.70) | Dalton Schultz (19.20) | n/a | Trey McBride (1.81) | Juwan Johnson |
| n/a | Kyle Pitts (54.60) | n/a | n/a | Brenton Strange (1.81) | Dallas Goedert |
| n/a | Sam LaPorta (54.30) | n/a | n/a | Kyle Pitts (1.80) | Dalton Schultz |
| n/a | n/a | n/a | n/a | Oronde Gadsden (1.79) | Travis Kelce |
| n/a | n/a | n/a | n/a | Juwan Johnson (1.76) | n/a |
| n/a | n/a | n/a | n/a | Brock Bowers (1.75) | n/a |
| n/a | n/a | n/a | n/a | Harold Fannin Jr (1.74) | n/a |
| n/a | n/a | n/a | n/a | Colby Parkinson (1.74) | n/a |
| n/a | n/a | n/a | n/a | Hunter Henry (1.73) | n/a |